Analytical Queries Overview
Business Intelligence Deliverables
These queries track and compare sales and cost over time. Sales tracked by location and sales class. Cost tracked by location, sales class, and split into labor, material, machine, and overhead costs. Calculate profit combining sales and cost tracked by sales class and location.
Quality control for performance and manufacturing quality tracks returns by location, sales class, and machine model and shipment delays by sales class and machine cost.
Query Workflow
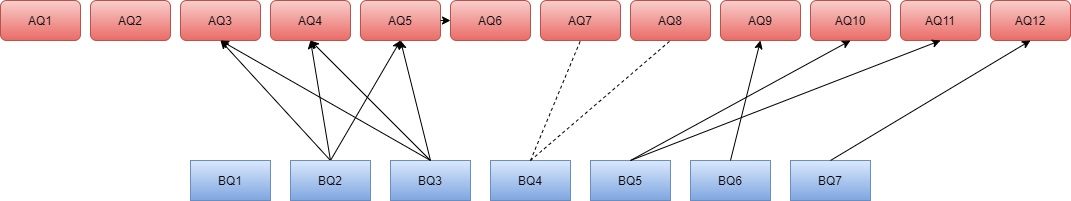
The workflow below represents all seven base queries and twelve analytical queries and there relationships.
Base Queries
BQ1 - Location name / sales class for job quantity and amount
Aggregates the sum of the quantity ordered and the sum of job amount(unit price * quantity ordered) from the job fact table. Attribute rows include location name, sales class, contract year, contract month, and base price. View Created.
BQ2 - Location invoice revenue summary
Aggregates the sum of invoice amount and sum of invoice quantity from the invoice fact table. Attributes include job id, location name, unit price, quantity ordered, contract year, contract month. Created view invoice_revenue_summary.
BQ3 - Location subjob cost summary
Aggregates sum of labor cost, material cost, machine cost (machine hours * rate per hour), overhead cost, total cost (sum all cost), quantity produced, unit cost (total cost/ quantity produced) from subjob fact table. Attributes include job id, location name, contract year, contract month. Created view location_subjob_cost_summary.
BQ4 - Returns by location, machine model, and sales class
Aggregates the sum of quantity returned (quantity shipped – invoice quantity) and the sum of the dollar amount of returns (invoice amount/invoice quantity * quantity returned) from the invoice fact table. Attributes include location name, sales class, machine model, invoice year, invoice month. Created view invoice_returns.
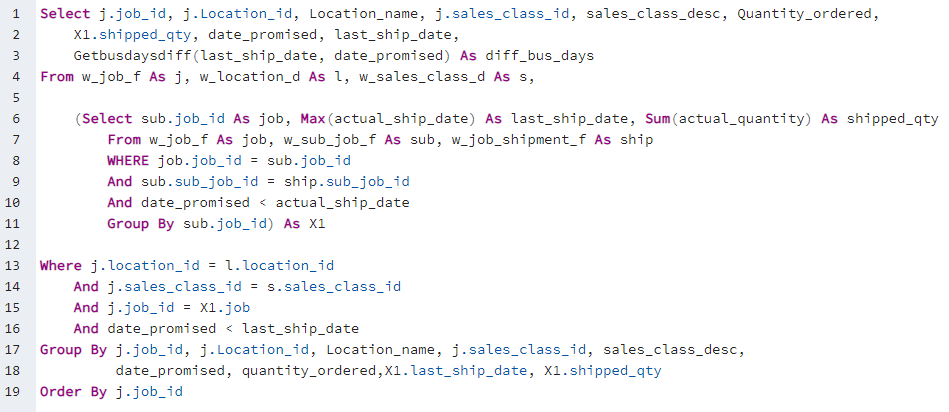
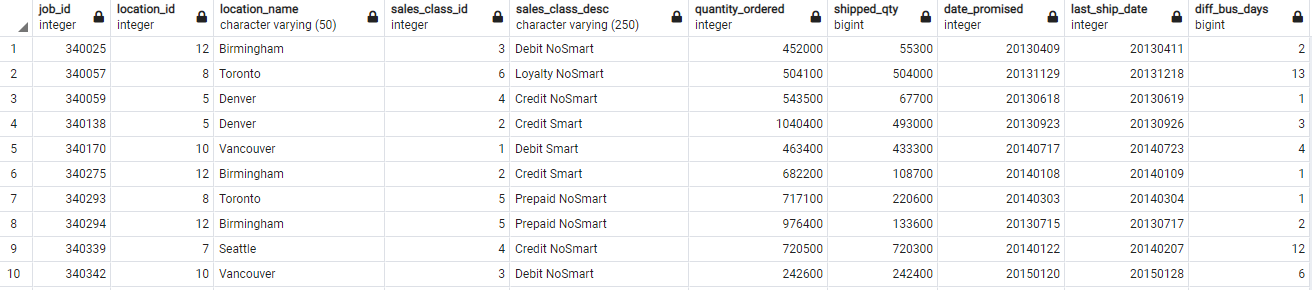
BQ5 - Last shipment delays involving date promised
Subquery aggregates the actual amount and max ship date of late shipments from the subjob fact table. The main query calculates how many days a shipment is late. Attributes include job id, sales class, location name. Created view last_ship_delays. Query and sample output is shown below in Figure 2 and Table 1.
BQ6 - First shipment delays involving shipped by date
Like BQ5, except for the subquery calculates minimum ship date. The main query returns the difference between the first shipment date and ship by date, or how many days the first shipment was late. Attributes include job id, location name, sales class. Created view first_shipment_delays_shipping.
BQ7 - Days from contract date to production start
This query returns the jobs with more than 20 business days between the jobs contract date and the first day of production, and the number of business days. Attributes include job id, location name, sales class, contract date. Created view delay_till_prod.
Analytical Queries
AQ1 - Cumulative sum for job amount by Location
Provides cumulative sum of job amount (unit_price *quantity ordered). It is partitioned by location name, contract year and ordered by contract month.
AQ2 - Moving average of job amount by location
Provides a moving average of job amount (unit_price *quantity ordered) for preceding 11 and current row. Partitioned by location name and ordered by contract year, contract month.
AQ3 - Profit Rank by location – uses BQ2 and BQ3 views
Returns profit (invoice amount – total job cost) and rank partitioned by location name and year. Uses views BQ2 and BQ3.
AQ4 - Profit Margin Rank by location
This query provides profit margin (invoice amount – total job cost/invoice amount) and rank. It is partitioned by year. It uses views BQ2 and BQ3. Created view profit_margin_rank.
AQ5 - Profit Margin Percent Rank by location
This query provides profit margin (invoice amount – total job cost/invoice amount) and percent rank. Attributes include job id, location name, contract year. Uses views BQ2 and BQ3.
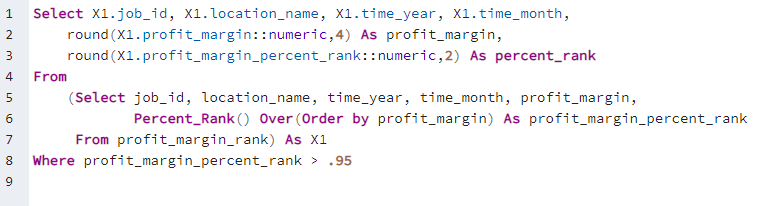
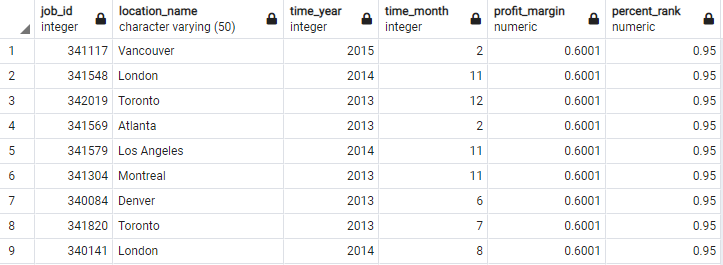
AQ6 - Profit margin Top 5% Performers percent rank by location
This query uses the AQ4 view to calculate the percent rank based on profit margin. Query and sample output is shown below in Figure 3 and Table 2.
AQ7 - Rank quantity returned by sales class
Extends BQ4, provides quantity returned by sales class, rank partitioned by year.
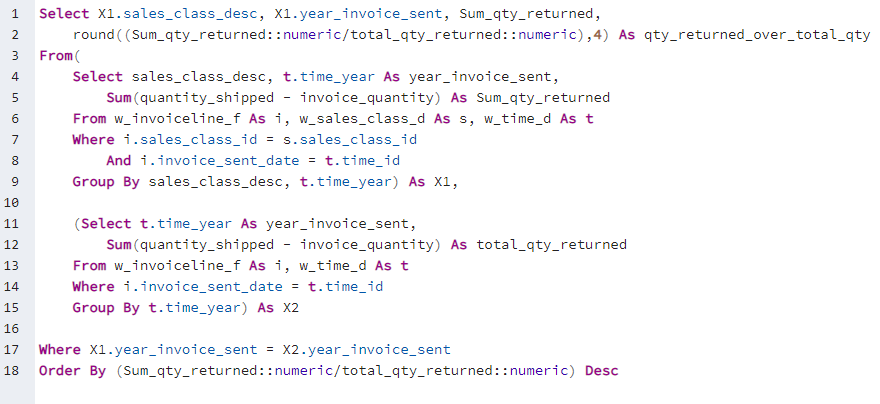
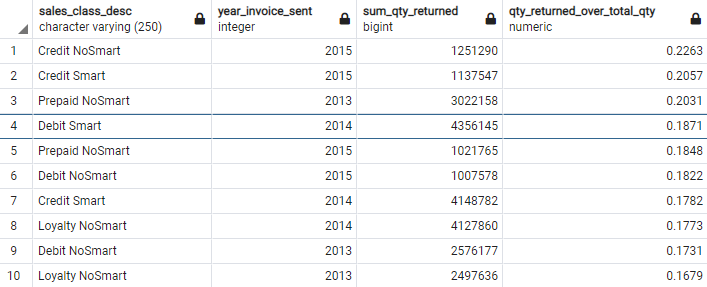
AQ8 - Return ratio by sales class
Extends BQ4, this query contains two subqueries. One provides the total quantity returned by year. The other provides the total quantity returned by year and sales class. The main query calculates the ratio of total returns by sales class and year. Query and sample output is shown below in Figure 4 and Table 2.
AQ9 - Rank location by sum of business day shipment delays for first ship date
This query uses BQ6 to return location rank based on the sum of shipment delays as the difference between the first ship date and ship by date. It is partitioned by shipment year.
AQ10 - Rank locations by delay rate for last ship date
Uses BQ5 to ranks last shipment delays by delay rate (quantity returned/quantity ordered). Partitioned by year.
AQ11 - Rank Location by sum quantity late
Uses BQ5 to rank location by total quantity shipped late. It is partitioned by year and includes the count of jobs delayed and the sum of shipments delayed.
AQ12 - Rank Location by days from contract to production
Uses BQ7 to rank location by the sum of days till production starts. Partitioned by year. Created view rank_days_prod.