Meteorite Study
The workflow shown below shows the primary workflow path the meteorite data takes to reach the final dashboard.
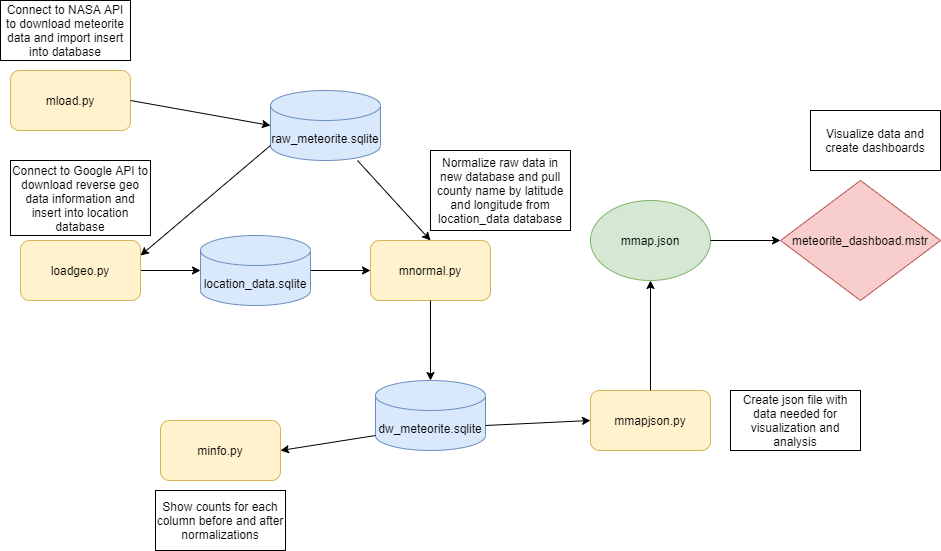
The Python file mload.py connects to a NASA JSON API, creates a single table database raw_meteorite.sqlite, and fills it with all available data. There are over 45,000 data rows of data.
The file loadgeo.py connects to a Google maps API that returns information about the given latitude and longitude. The location's county is the only information needed for this project, but all the data is stored in location_data.SQLite as the complete JSON file returned, thus preserving all location data for any future needs.
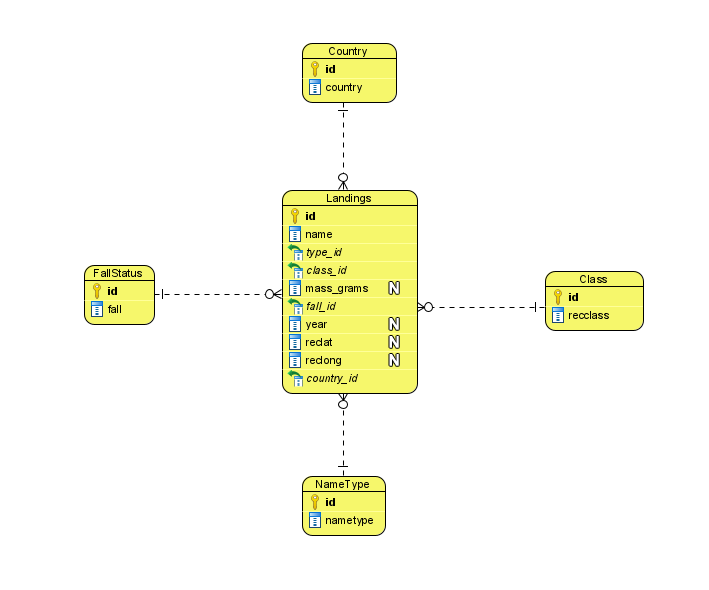
mnormal.py normalizes the data by creating five tables, Landings, Name type, Class, Fallstatus, and Country, then fills them with the appropriate data and assigns the ids. The normalized ERD is shown below, Figure 2.
The file minfo.py pulls from dw_meteorite.SQLite and raw_meteorite.SQLite and displays the count of all none null data points in each column for each database. This will give visibility on how successful the normalization was.
Mmapjson.py converts the data need for our dashboard into a JSON file to be used by meteorite_dashboard, shown below.
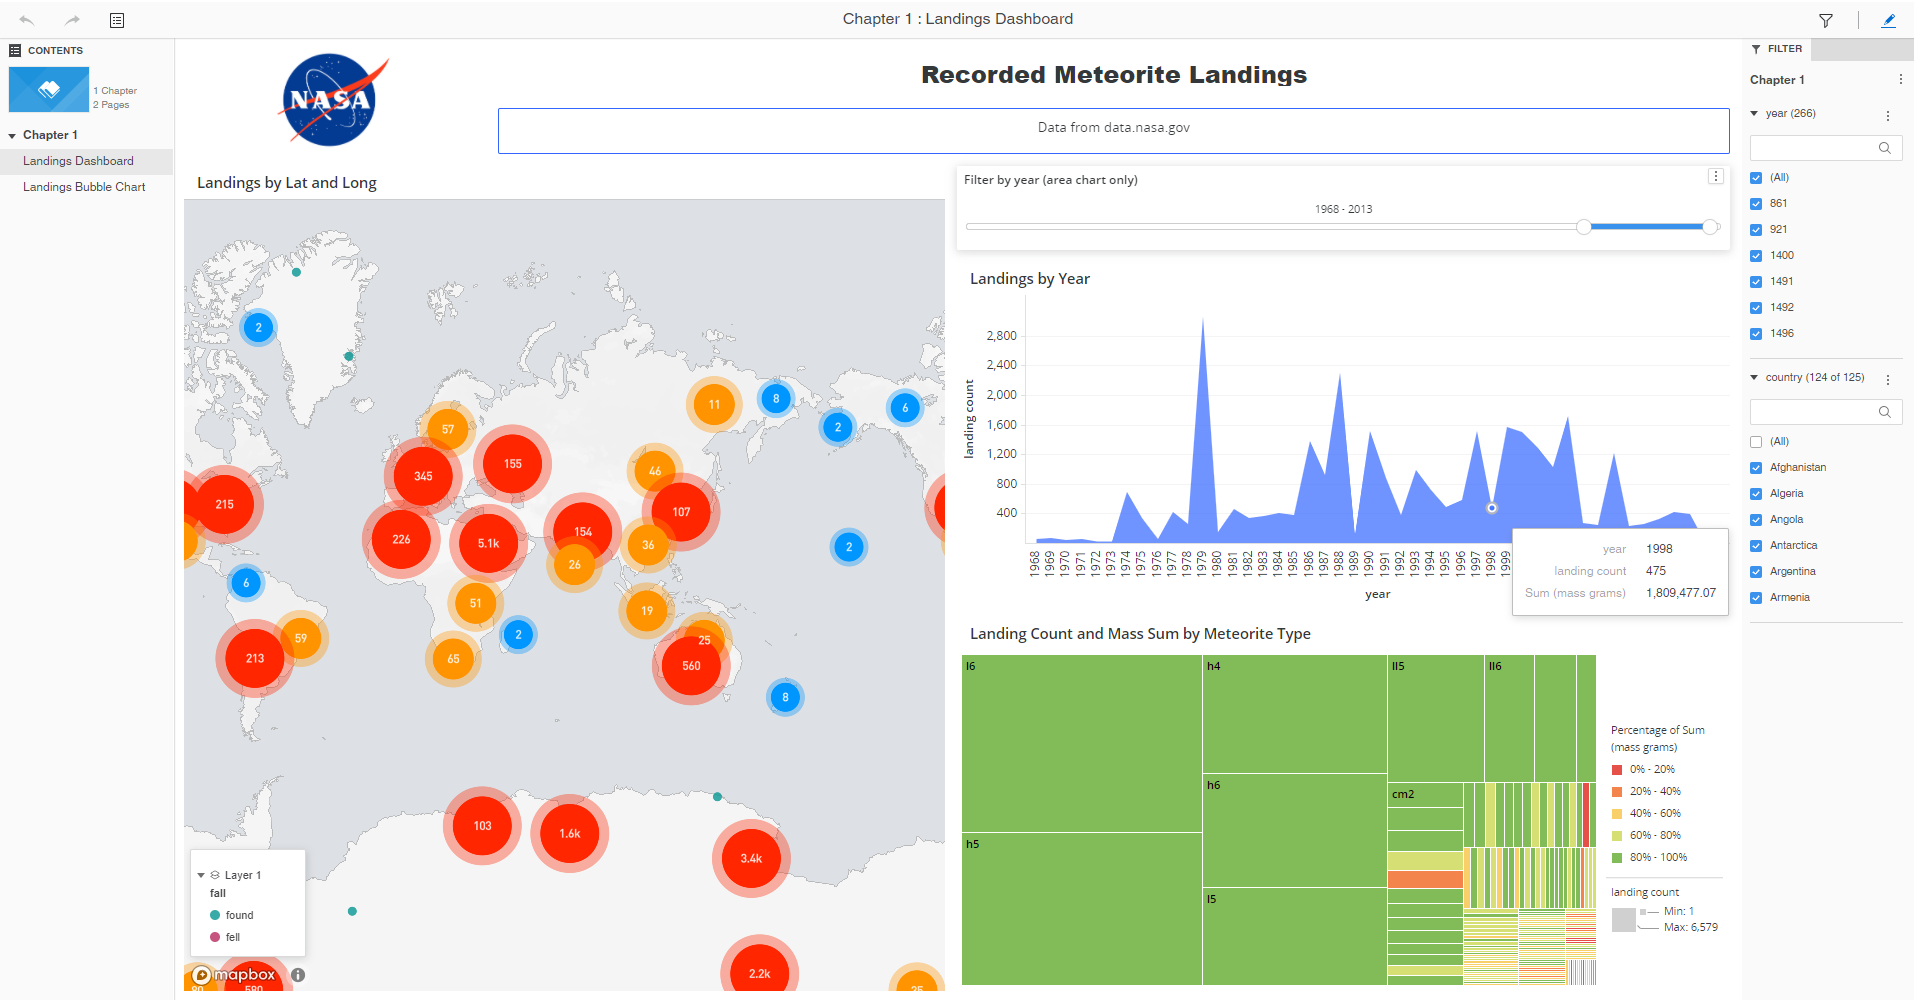
Figure 3, Left: Meteorite landing count shown by latitude and longitude. Right top: Landing count by year. Right bottom: Landing count and mass sum by meteorite type.
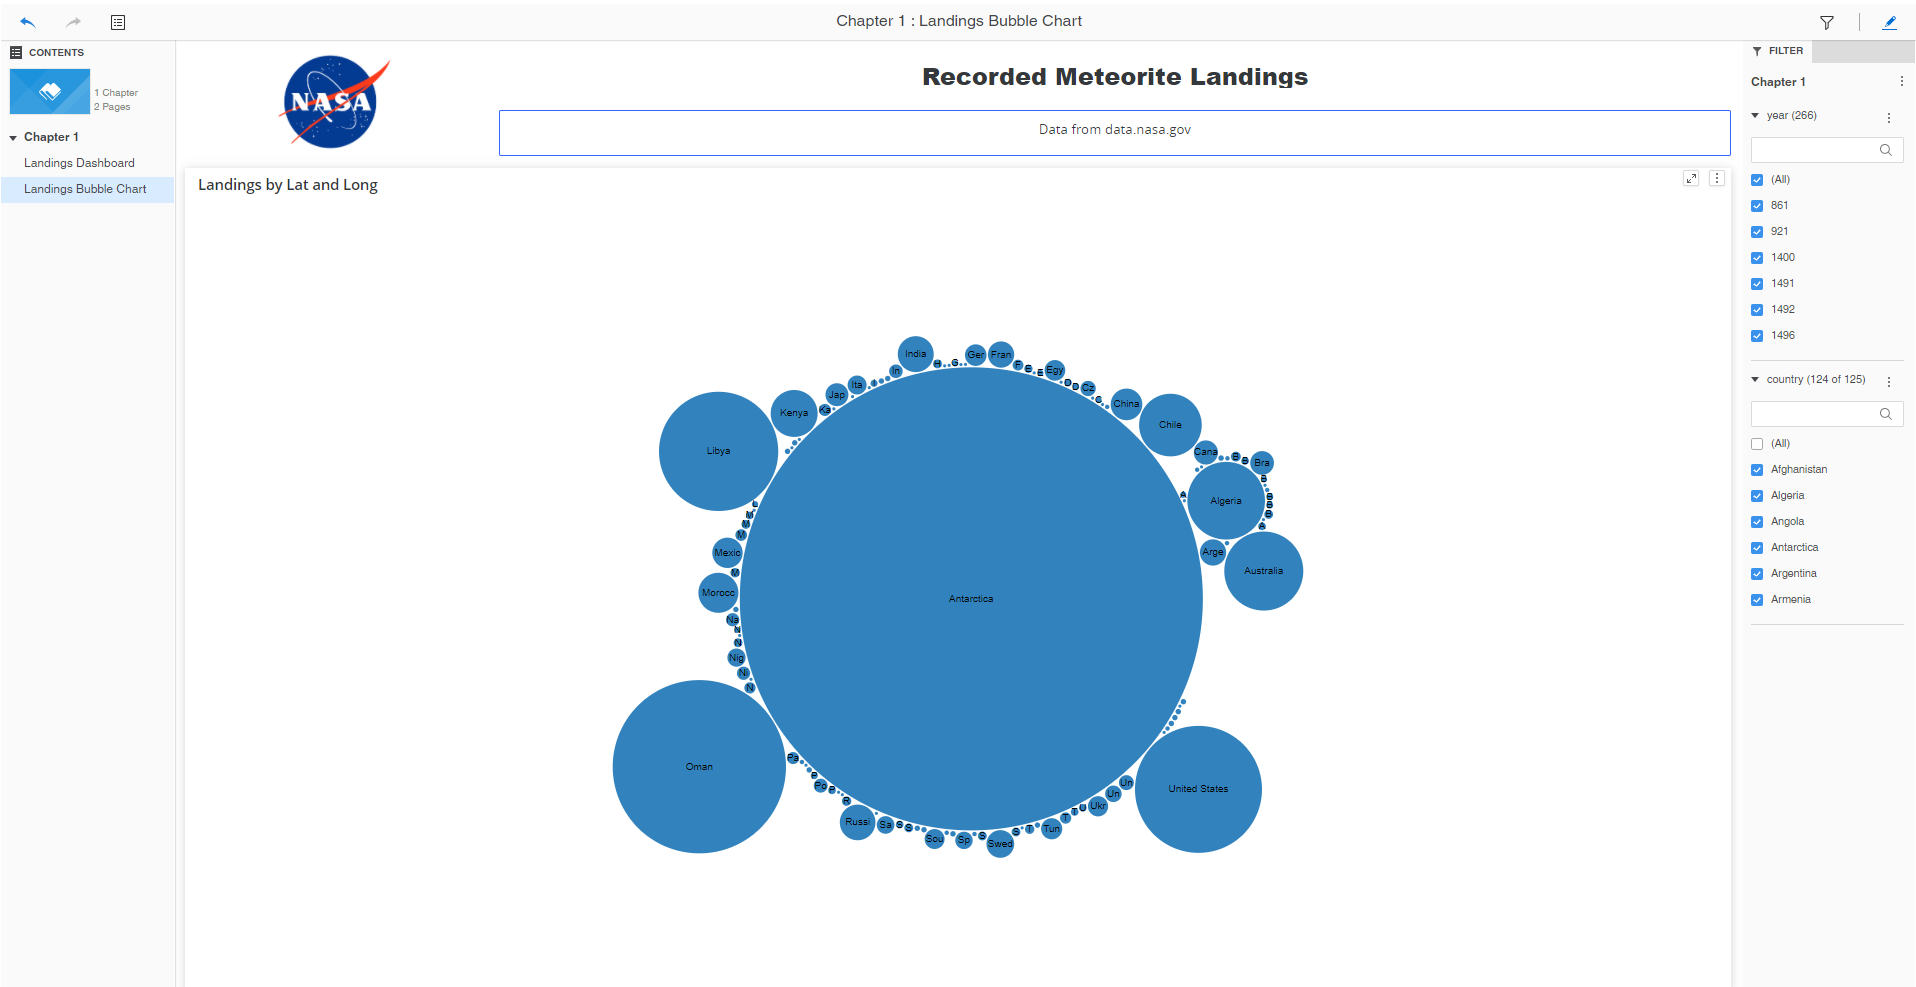
Figure 4, Bubble chart showing meteorite landing count by country. It is helpful to remove Antarctica and compare the resto of the countries.